Peanuts #2; A Deep Dive Into Us and Global Demand

by: Sidnee Hill and Matt Harrod
In this second installment of our analysis on the peanut production industry in the US we will be looking into peanut demand both domestically, and around the world. Deeply understanding the dynamics of a commodity’s demand is one side of the pricing penny, the other side of course being how well farmers can supply that market need.
US Demand
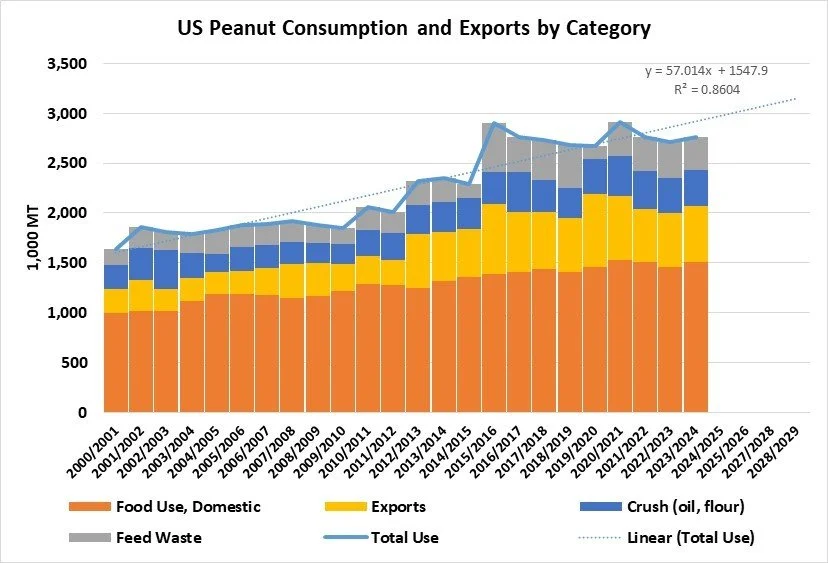
Per the chart above, US peanut consumption is a somewhat mature but steadily growing market, with an average annual growth rate of 1.9% from the 2000/2021 crop year to the 2023/2024 crop year. But that compounding figure has a meaningful impact as domestic consumption has increased from 1,402,000 MT in the 2000/2021 crop year to 2,198,000 MT in 2023/2024 or an increase of 57% over that period.
Exports on the other hand have increased at a higher rate of 3.7% annually from 239,000 MT to 567,000 over the same period, a total increase of 237%.
The second chart we have below shows US peanut consumption by category, including food use, exports, crush (oil, flour), and feed / waste. Of these, food use is by far the largest category with 54% of total use in 2023/2024, exports is second with 21%, crush is third with 13%, and feed & waste last at 12%.
Also note the trendline (dotted) through the blue line representing total use. If the current 25-year trendline holds, total US peanut production and usage would exceed 3,000,000 MT by 2028/2029.
Global Demand
In the global arena the United States remains a key player in both production and export. In 2023 US was the 4th largest peanut producer[1] and makes up 5% of the 5-year average total global production by metric tonnes[2]. The largest force in global peanut production continues to be China with 36% of the 5-year global average, followed by India and Nigeria.


As we look at the export market, things quickly change. Note that although China is by far the largest producer of peanuts with 36% of global production, it exports proportionally much less and is the 5th largest exporter. The United States becomes the 3rd highest exporter behind Argentina and India, providing 13% of global exports.

This global market is a key tenant of the success of the US peanut industry. Even though domestic peanut consumption continues to remain the significantly stronger portion of demand, the 5-year average peanut export amount of 504,340.54 MT is still an important piece to the equation. From 2022 to the 2023 calendar year, we saw a growth of 19.85% in quantity exported. Looking forward to this 2024 year USDA reports 7.66% greater US exports in the January to July period of 2024 than the same period in 2023. The greatest portion of that increase coming from the Netherlands with a 20,000 + MT Jan-Jul period increase in imports this year than last.
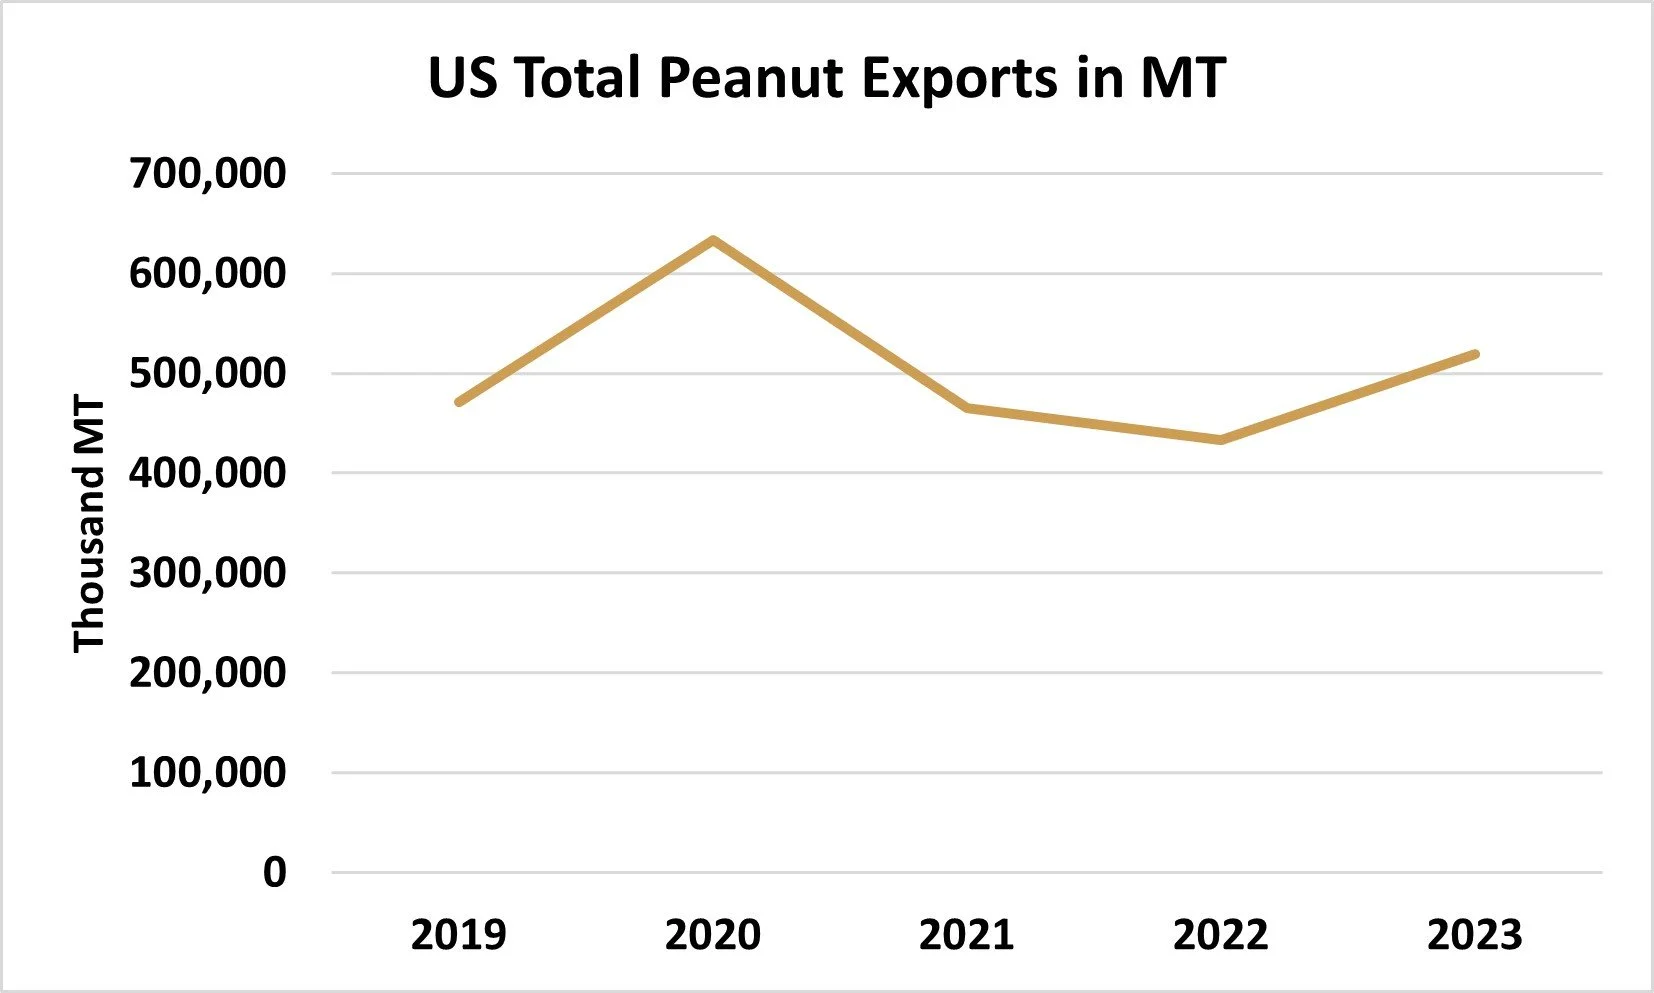
The value received for these peanuts shows another interesting side of this story. While the 2022 crop year held our weakest export quantities in the past 5 years, the total value received increased by 2.28% from the 2021 values. Year over year changes in value of peanut exports have increased steadily since 2021 and are 14% higher in the 2024 January to July period than the same period in 2023.

While it is nice to see greater returns for our peanut crops, we have to carefully watch these types of trends in anticipation of how the individual importing countries will react. Will our higher costs motivate them to seek peanuts from other shores? To answer this, we must first understand who our global customers are.
Global Customers
Since 2019 our top 5 global customers have remained consistent: Mexico, Canada, China, Netherlands, and the UK. Just like any business, understanding your customer gives insight into how we predict demand from them in the immediate future.
Like all exported US agricultural commodities China’s unpredictability in consumption adds some variability to the export trends, and some speculation as to what they will do in the future.

The United States-Mexico-Canada Agreement (USMCA) is probably the most important trade agreement for United States Agriculture. Geographic proximity is a major predictor of the amount of trade between two countries.
In our next article in this series we’ll delve deeper in the US supply side of things, including a finer look at regional variations and the dynamic relationship between peanuts and cotton.
[1] US is 4th largest, not including ROW (Rest of World), which comprising the sum of all smaller producing countries.
[2] All figures in this document are in metric tonnes unless otherwise stated.