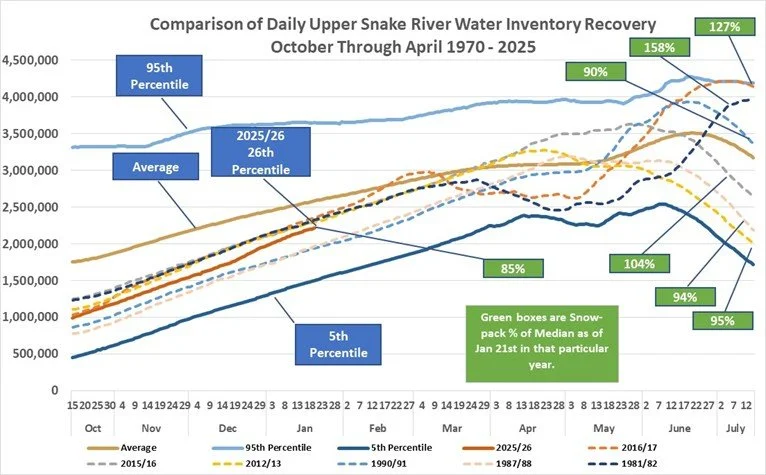
ID Snake River Water Update: Do We Have Enough for 2026?
As we continue to track the volume of water behind the dams in the upper Snake River system it’s apparent that this season we are coming out of lower-than-average water inventories (water stored behind the dams) and a below average snowpack with which to refill the system. How concerned should we be about water availability this season?
Read More
2025 NCREIF US Farmland Value Regional Review; Despite Some Regional Losses, the Portfolio Posts Slight Gains
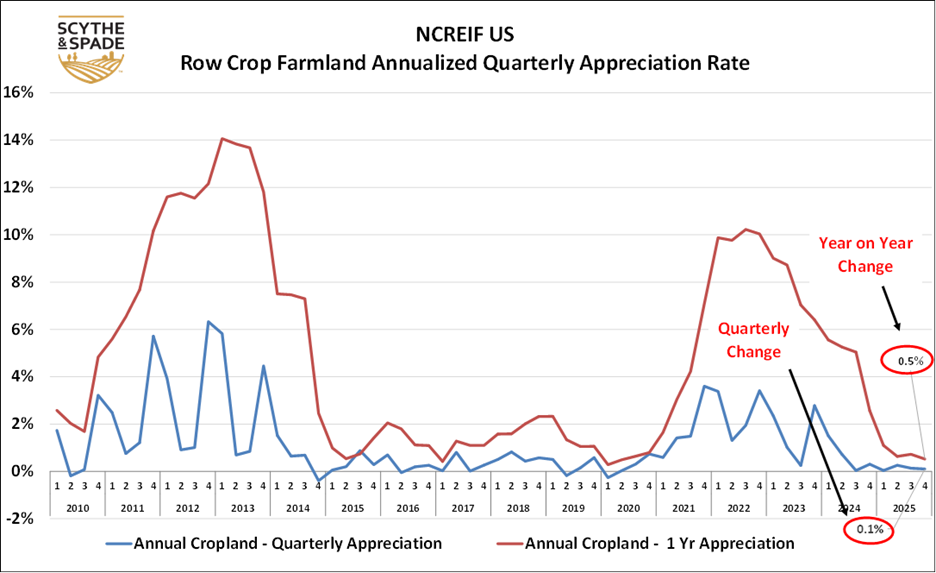
US row crop land values finished the year +0.5% over 2024 with incremental increases in each quarter in 2025. This continues a record of no decreases in year over year values going back to the start of NCREIF farmland values tracking in 1992. While there have been small individual quarter-over-quarter value decreases, most recently in 2020, year-over-year NCREIF row crop farmland has never shown a loss of value vs the prior year.
Read More
Post #3, Have Farmland Values Appreciated in 2025? California and the Pacific Northwest
The NCREIF California Row Crop Farmland portfolio has had a difficult time over the last two years, with losses in value in each consecutive quarter since Q2 2023. Meanwhile, the Pacific Northwest, the region least correlated to the others, continues to shine.
Read More
Post #2, Have Farmland Values Appreciated in 2025? The Cornbelt and Delta
It’s been a tough year in the US for Row Crop prices like corn, soybeans, rice, and cotton. In part #2 of our “Have Farmland Values Appreciated in 2025?’ we take a look at the Cornbelt and Delta regions.
Read More
Have Farmland Values Appreciated in 2025?
As we approach year end, we are watching NCREIF Row Crop farmland returns, particularly the appreciation rates, to see if it can maintain its record farmland price values in the face of the low commodity prices and other agricultural headwinds we have seen this year. This is the 1st of a three part post checking on where things stand by region and where they may end up. The results are mixed…
Read More
U. S. Tree Nut Supply and Demand
The US is a major international producer and exporter of tree nuts. In this first of a multi-part series, we will contrast and compare Almond, Pistachio, Hazelnut, and Walnut costs and cash returns, historical production and export data.
Read More
Agricultural Land Value Changes (post #4)
Appreciation rates as reported by NCRIEF Annualized Quarterly data show a Year-on-Year increase of 0.6% for annual cropland. Meaning that while the average value of U.S. row cropland is still appreciating in value, it is doing so at an ever-slower rate since 2022.
Read More
Mid-Year Economic Outlook #3: Farmer Sentiment of the Ag Economy
The Purdue/CME ag economy barometer is used to measure the health of the U.S. agricultural economy through a nationwide monthly survey of the sentiment of agricultural producers and agribusiness leaders. It will be interesting to see if the positive outlook reflected in the Current and Future Expectations remain following the recent USDA harvest yield and acreage report, which forecast record yields and the largest ever corn crop.
Read More
Mid-Year Agricultural Economic Outlook #2: Input Prices
The USDA tracks prices received and paid by farmers in the Agricultural Prices Report, an index utilizing 2011 as a baseline. Since January 2025 we have seen a steady increase in prices paid for input costs, with the June All Items index 10 points higher than the previous year.
Read More
Mid-Year Agricultural Economic Outlook #1: Commodity Prices
This is the first post in a series of four production agricultural economics updates and outlooks, beginning here with current and USDA forecast crop prices. This will be followed by crop input prices, farmer sentiment outlook, and farmland prices.
Read More
How Much Do You Trust Your Advisors?
Last week, after wrapping up a series of meetings, I departed from the Yuma Arizona Regional Airport in my trusty Cessna P210 with a clear sky and a full agenda ahead. But shortly after takeoff, a warning light forced me to turn back.
Read More
An Elite Team: More Than the Sum Of Individuals
Coming out of our 2nd Trimester Strategy and Execution Planning meeting—where we lived, worked, and recreated together as a team—I found myself deeply moved, surrounded by a gritty yet respectful group who over the course of a week of intense meetings remained collaborative and energetic, passionate and motivated. The experience reminded me just how Elite this team is.
Read More
Idaho ESPA Could Soon Include Surrounding Tributaries
The Idaho Department of Water Resources (IDWR) proposes expanding the ESPA to include five tributary basins, aiming for fairer water management and increased accountability amid ongoing aquifer decline and water rights disputes.
Read More
What is Your Farmland Investment Risk Profile?
While farmland is often shown and thought of as both a good hedge against inflation and often lower risk than stocks, that data usually of returns of US farmland as a whole. If your farmland holdings are all within one region, you may have a higher risk/return profile than you might believe.
Read More
NCREIF Cornbelt Farmland Appreciation Goes Negative in 2024
A regional exception to a positive rowcrop farmland appreciation rate in 2024 is the Cornbelt, which finished 2024 with a slight loss of year-on-year value of -0.5%. Is this a forebearer of corrective negatives in other regions?
Read More
US NCREIF Rowcrop CAP Rates Tighten in 2024
NCREIF US Row Crop 2024 CAP rates were 3.0%, down from a recent peak of 3.7% in 2022 and continuing a long-term compression trend.
Read More
NCREIF US Row Crop Farmland Appreciation Remained Positive in 2024
NCREIF US Row Crop Farmland values increased by 2.6% year over year (red line in the nearby chart, continuing a downward trend since peaking at about 10% in 2022
Read More
Idaho Surface and Ground Water Users Reach Agreement (For Now). What It Means:
After months of closed-door conversations between Idaho’s Surface Water Coalition (SWC), Eastern Snake River Plain Aquifer (ESPA) groundwater district representatives, the Idaho Department of Water Resources, and the state’s own Lt. governor- a new water mitigation plan has been finalized.
Read More
Corn Prices, Farm Returns, and Appreciation Rates
While doing some work for a client recently, we pulled together several charts that have very similar patterns: Net Cash Farm Income, the rolling nearby corn futures price, and the NCREIF US Rowcrop Farmland Appreciation rate. What they tell us is that low corn prices have a surprising effect, well outside of the corn belt.
Read More
Peanuts #3: Factors of Peanut Supply
There are at least 6 things that can increase, or decrease, our supply of a commodity. Here we look at each one of these factors in turn to better understand the production of peanuts.
Read More